How to Use Crawl Stats in Google Search Console
Spot slow servers, wasted crawl budget, and robots.txt blocks before indexing slips.

The crawl stats report within Google Search Console is one of those tools that many site owners ignore until something breaks. When you need to perform a site health audit, it quickly becomes one of the first places to look.
If Google keeps visiting your site but pages still lag behind, this report can show where the bottleneck sits. It serves as a vital diagnostic tool for technical SEO, revealing whether your server is slow, if Googlebot is wasting resources on junk URLs, or if problematic response codes are piling up.
While the report will not hand you the fix, it will point directly to the problem, whether that is a slow server, crawl waste, or a rule quietly blocking Googlebot.
You will find it under Settings (Property settings) > Crawl stats, in the property settings panel rather than the main left-hand menu. One catch: it is only available for root-level properties, so a Domain property or a root URL-prefix property shows it, but a subfolder property like example.com/blog/ will not. Google’s Crawl Stats help page has the full reference; the real trick is knowing what the numbers mean and what to do next.
Key Takeaways for the Crawl Stats Report
- The crawl stats report provides visibility into how often Google crawls your site, how much data it downloads, and how responsive your server is.
- The report is built for larger or more complex sites and for catching server and host problems. If your site has fewer than a few thousand pages, you rarely need to worry about crawl budget.
- Focus on sudden spikes, sharp drops, rising response times, and repeated errors rather than chasing a perfect chart.
- Your robots.txt file plays a major role in determining which parts of your site remain accessible to Googlebot.
- Combining crawl stats data with a strong content workflow and internal linking strategy can help you identify search issues before they impact traffic.
It also helps to bring Search Console data closer to where you actually work. You can even pull your Search Console data into Claude to dig through crawl and indexing issues in plain language. Pair that with clean internal linking and you will catch search problems well before they turn into traffic losses.
What the Crawl Stats Report Actually Shows
Open the report in Google Search Console, and you will see a few core signals. Google’s crawl stats update post explains the newer breakdowns, and they are worth knowing.
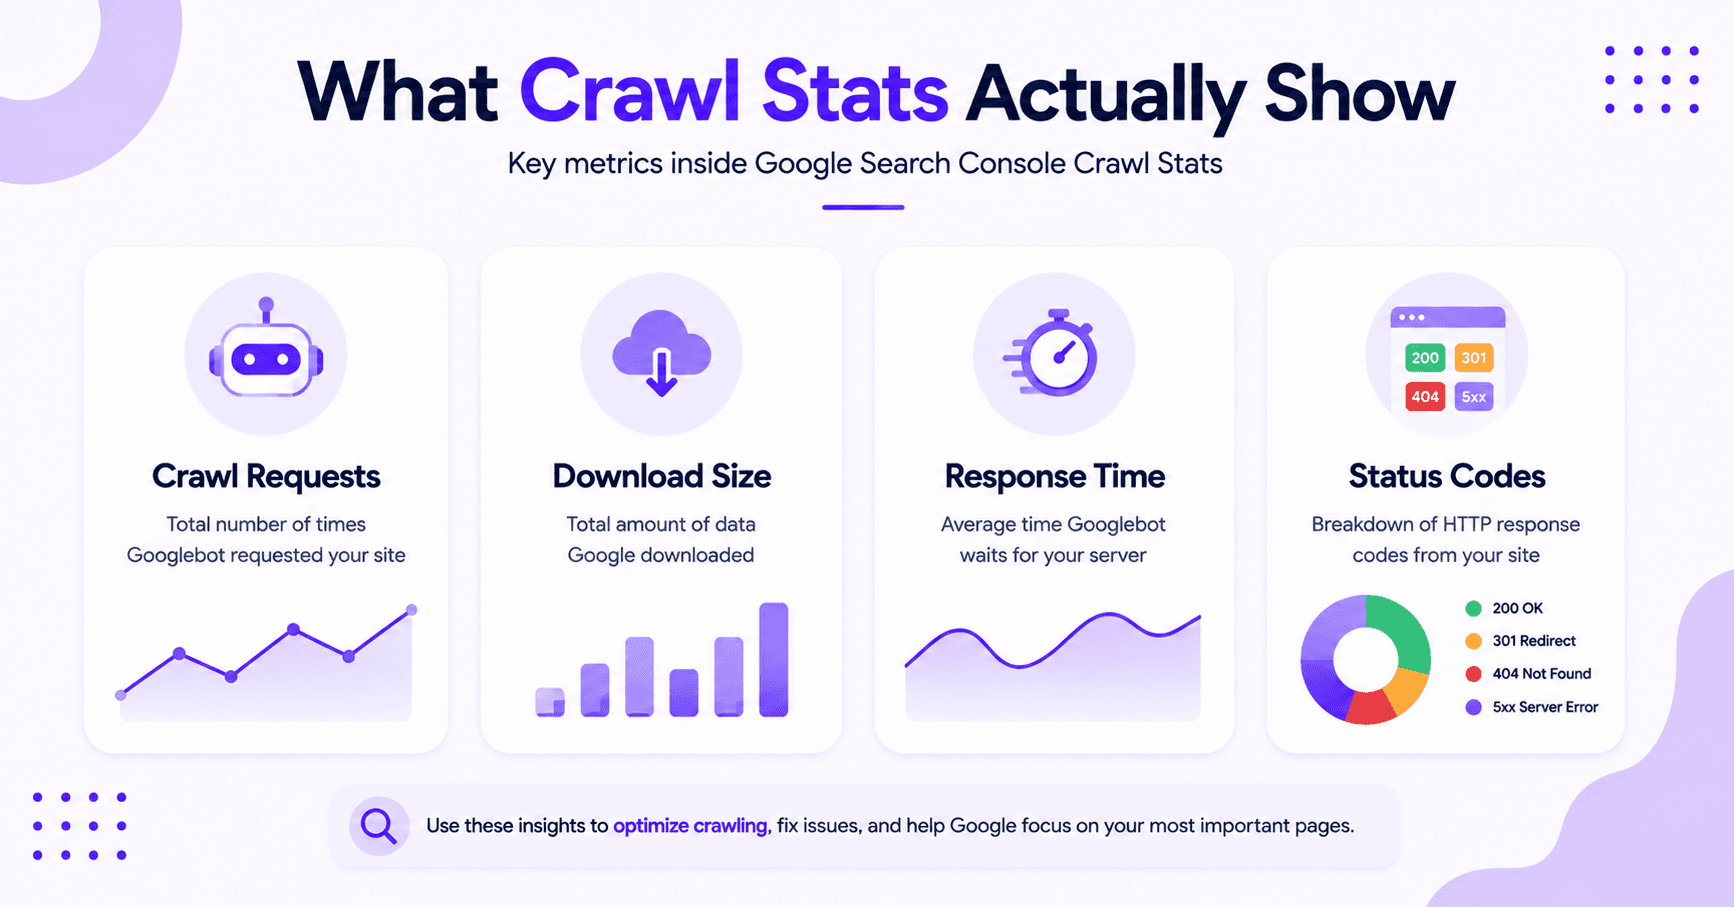
Total Crawl Requests
The first thing to watch is total crawl requests. That number tells you how often Googlebot made crawl requests to your site.
It includes successful requests and failed ones, so do not treat the total as a score.
Total Download Size
Next comes total download size. If that number climbs fast, Google is pulling more data per crawl.
Heavy images, bloated scripts, and oversized pages can push it up. That is not always a problem, but it can hint at a site that is getting harder to crawl.
Average Response Time
Then there is average response time. This is the one many site owners miss.
If Google has to wait longer for pages, crawl efficiency drops. Monitoring your average response time is essential because slow performance can show up here before users feel the pain.
Response Codes
The report also breaks down crawl responses by status codes. You will see groups such as:
- 200
- 301 redirect
- 404
- 5xx
That mix is gold. It tells you whether Google is finding clean pages, redirects, missing URLs, or server errors.
The crawl stats report is easiest to read when you treat it like a dashboard, not a trophy.
File Types, Crawl Purpose, and Host Status
You also get file types and crawl purpose. The breakdown of file types shows whether Google spent time on HTML, images, CSS, JavaScript, or other assets.
Crawl purpose tells you whether Google was focused on discovery of new URLs or a refresh of older ones. A discovery-heavy split usually means lots of new or poorly linked URLs, while a refresh-heavy split means Google is mostly revisiting pages it already knows.
Finally, the report includes host status and example URLs. Host status is assessed in three parts over roughly the last 90 days: robots.txt fetching, DNS resolution, and server connectivity. If any one fails too often, Google slows or pauses crawling.
You can also filter by Googlebot type to see how the smartphone crawler is hitting your pages compared with desktop, image, or page-resource crawls.
One 2026 note: this report only covers Googlebot and Google’s search crawlers. It does not include Google-Extended, the separate crawler Google uses for AI training, so you cannot use Crawl Stats to measure AI crawler activity. For that, check your server logs.
Example URLs help you move from the chart to real pages, and that is where the work starts.
A healthy crawl pattern is often boring. That is a good sign, not a flaw.
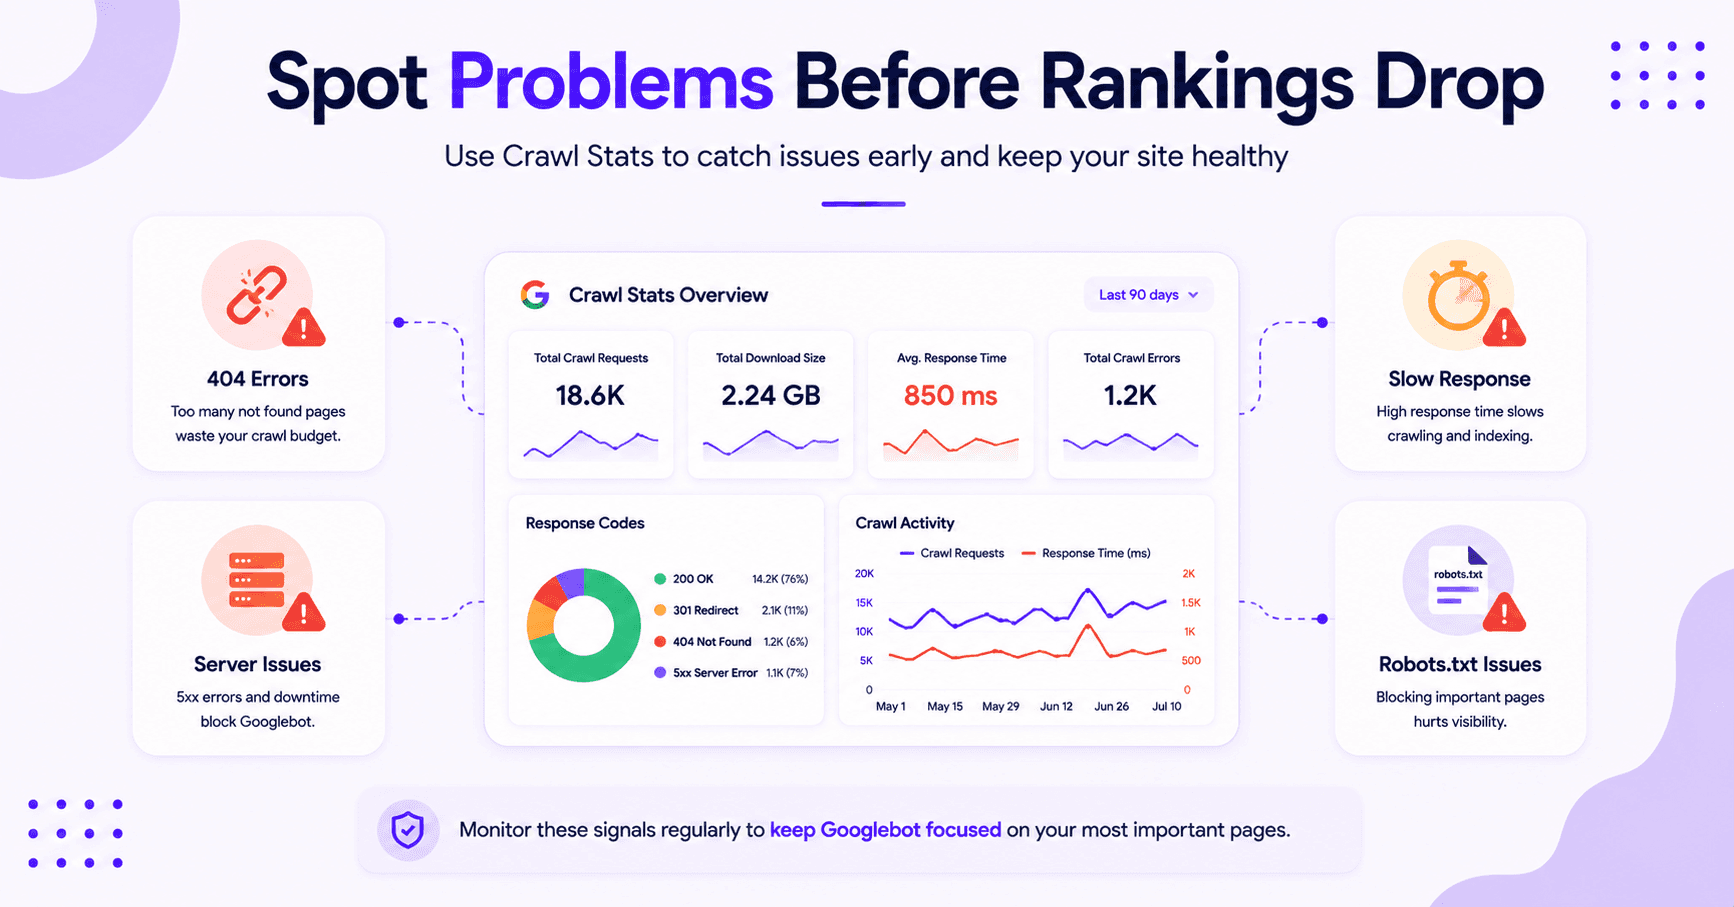
How to Read Crawl Stats Without Guessing
Start with the trend line. Do not stare at one day and panic.
Look at a few weeks at once because crawl requests often fluctuate due to shifts in search behavior, publishing schedules, or server load.
Ask one simple question first: how has crawl activity changed relative to the rest of the site?
If Googlebot used to hit 20,000 URLs a week and now it is hitting 8,000, something changed. That could be technical, structural, or both.
Then compare average response time with response codes. If response time climbs and server errors like 5xx codes rise with it, you may have a server capacity problem.
If response time is fine but 404s explode, you are probably dealing with:
- Broken internal links
- Expired URLs
- A poor navigation structure
File type also tells a story. If Google keeps spending a lot of time on CSS, JavaScript, or images, it may be crawling more assets than pages.
The report purpose split helps, too. When Google spends more time on discovery, it implies your site has many new URLs or weak crawl paths.
When refresh activity dominates, Google is revisiting pages it already trusts. That balance changes with site size, content cadence, and link depth.
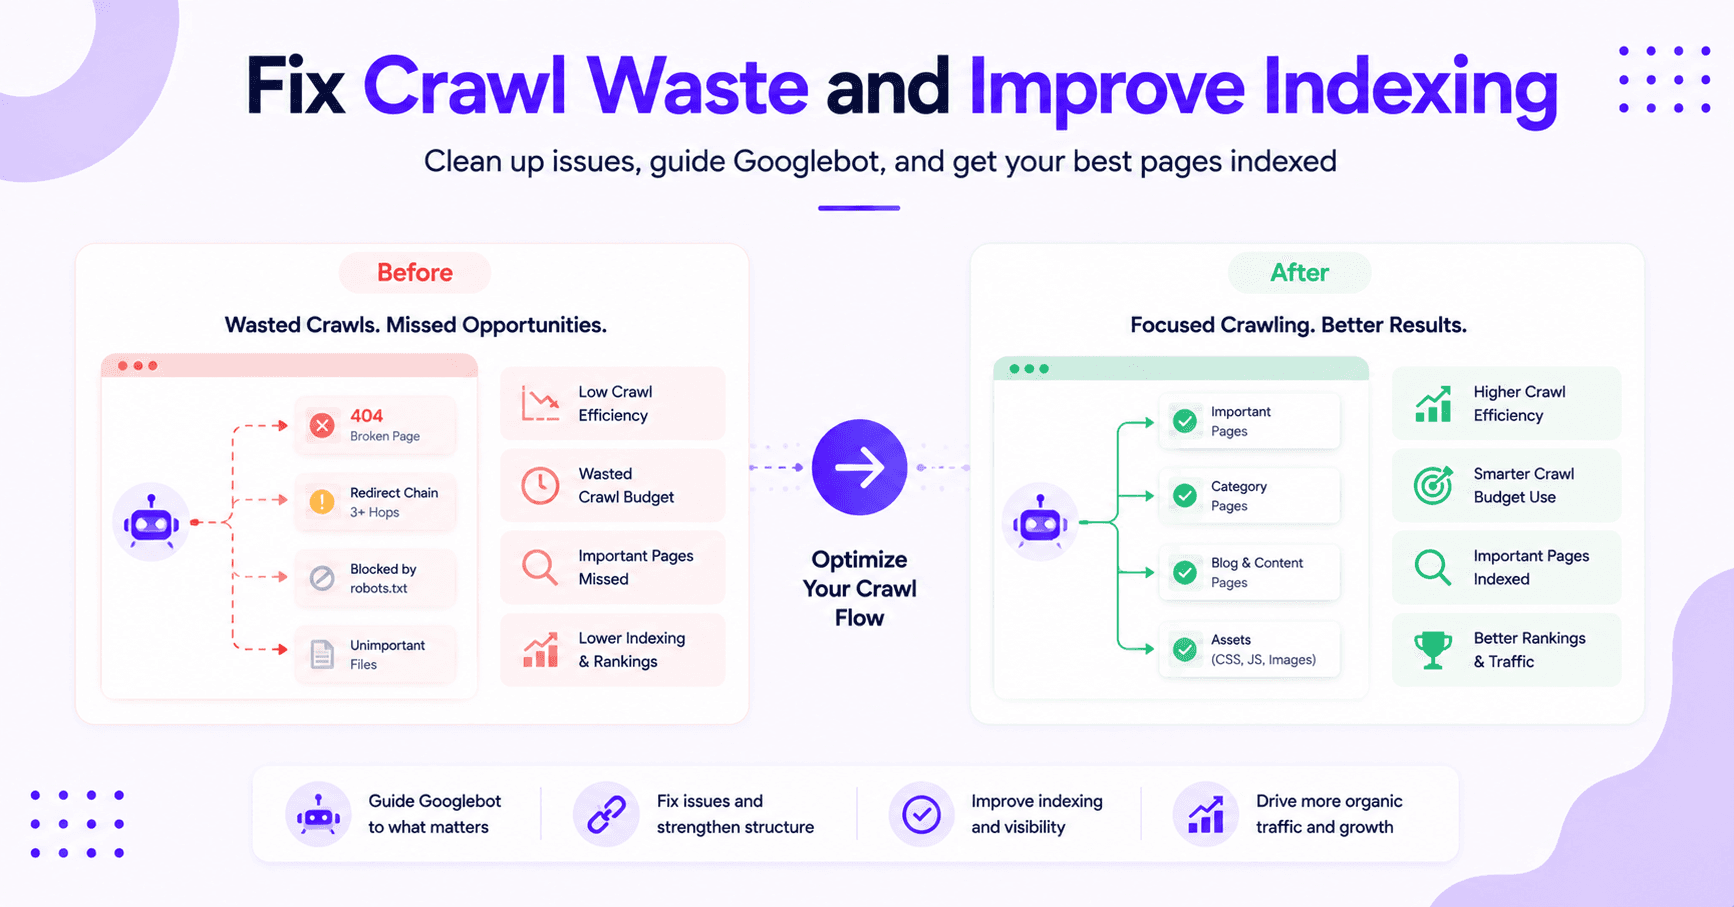
For many small and mid-sized sites, the report is less about the old crawl budget debate and more about removing waste.
If Googlebot spends time on junk, you will feel it. If it spends time on the right pages, indexing becomes much more efficient.
What Common Crawl Patterns Usually Mean
A slow but steady crawl rate can be perfectly fine for smaller websites. It may indicate that Google views your site as a lower priority, which is not necessarily a penalty.
Often, this simply means the site lacks sufficient strong signals to warrant aggressive crawling.
A sudden drop in requests tells a different story. The usual causes are a new or overly broad robots.txt rule, a slow or erroring server that makes Googlebot throttle itself, or a firewall or security plugin blocking the bot. Stale, low-demand content can also pull crawling down over time.
If the decline lines up with a recent deployment or plugin update, that is the first place to look. Note that a noindex tag does not cause this: Google still has to crawl a page to see the noindex, so a crawl drop points to access or server issues, not indexing directives.
A jump in 404 not found errors often means your internal links are stale. You might have deleted a page without setting up proper redirects, or old product URLs may still be active within your navigation or content.
Google will continue to attempt those paths if it can still find them.
A rise in server errors deserves fast attention. This usually indicates hosting limits, inefficient caching, broken code, or traffic spikes.
The crawl stats report acts as an early warning system, confirming that the problem is real even if it does not identify the specific culprit.
If the host status turns red or shows warning signs, avoid guesswork. Investigate:
- DNS resolution
- Server connectivity
- Firewall rules
- Security plugins
Google bots are rarely the root cause of these issues. The underlying infrastructure is almost always where the solution lies.
What to Fix After You Spot an Issue
The best next step depends on what the report shows. If the issue is site performance, fix the server first.
If Googlebot is struggling with slow page resources, better content will not help much. To go further, a server log analysis gives you the granular data to pinpoint exactly where the server is bottlenecking.
If the report shows a high number of bad URLs, clean up your internal links and redirects.
- Remove dead paths from menus and footers.
- Use a 301 redirect to point traffic to relevant live pages.
- Exclude unnecessary paths through your robots.txt file when appropriate.
- Ensure important pages are linked clearly from accessible sections of the site.
If crawl stats look healthy but pages still stall in indexing, the problem may not be crawl access at all.
In that case, the issue may be content quality, duplication, or weak page purpose. Working through crawled – currently not indexed is the next logical step to improve your indexing.
If you fix a page and want Google to revisit it sooner, use Search Console’s request indexing flow. It does not guarantee instant results, but it can move a page into the queue faster.
The point is simple. Do not treat the crawl stats report like a report card. Treat it like a map.
It shows where the roads are blocked, which routes are slow, and which URLs keep causing trouble.
If you are working inside a broader SEO workflow, particularly within the context of enterprise SEO, you must connect the dots with content updates, optimized internal links, and technical checks.
That is where the report becomes truly powerful. It stops being just another chart and starts being a critical decision tool for your long-term strategy.
FAQs About Crawl Stats in GSC
A few questions that come up often:
Is a decline in crawl requests always a sign of a penalty?
Not necessarily. While a significant drop can indicate technical issues or misconfigured robots.txt files, it often reflects a change in how Google prioritizes your content.
Focus on investigating whether your site architecture or server health caused the change rather than assuming an algorithmic penalty.
How often should I check my crawl stats report?
For most site owners, a monthly check is sufficient unless you have recently deployed major site changes or migrated content.
If you are managing a large-scale enterprise site with frequent updates, you may want to monitor the report weekly to catch spikes in errors or performance issues early.
Can the crawl stats report help me speed up my website?
Yes, by providing average response times for your pages. If you notice these times increasing, it is a strong indicator that your server is struggling to handle requests efficiently.
You can use this data to identify bottlenecks and optimize your backend performance to provide a faster experience for both crawlers and users.
What should I do if Google is crawling too many low-quality pages?
If you notice Googlebot wasting resources on junk URLs, you should evaluate your internal linking structure and use your robots.txt file to block unnecessary paths. Preventing access to non-essential or duplicate pages ensures that Google spends its crawl budget on the content that actually matters for your rankings.
Final Thoughts on Crawling Stats in GSC
The crawl stats report in Google Search Console gives you a clear read on how Googlebot moves through your site. By monitoring volume, speed, errors, and crawl purpose, you can spot technical SEO problems before they impact your overall site performance.
If the chart looks calm, keep it that way. If it shifts, look for the underlying cause before you chase rankings or rewrite content. While the data here won’t solve every issue, it will point you toward the right fixes for better indexing and site health.
Treat crawl stats as your roadmap: they tell you where to aim your effort, whether that is the server, your internal links, or a stray rule blocking the bot. Fix the cause the report points to, not the chart itself.

Article by
RightBlogger Co-Founder, Ryan Robinson teaches 500,000 monthly readers how to grow online businesses. He is a recovering side project addict.


New:Site Agent
Automated SEO Blog Posts That Work
Try RightBlogger for free, we know you'll love it.
- Automated Content
- Blog Posts in One Click
- Unlimited Usage


Leave a comment
You must be logged in to comment.
Loading comments...